Solving Word Ladders With Graph Theory
If you read the newspapers like me (yes, people still do that), you may have come across a “word ladder” in the puzzle section. It’s a simple little game where you are given two words (a start and an end) that have the same number of letters, and you have to progress your way up the ladder, changing one letter at a time in a fixed number of “hops” until the word equals the end word. What makes this game particularly challenging is that each “variation” of a word must be a valid word. In other words (see what I did there 😀), it must be found in a dictionary.
For example, if you were given the start word of “LION” and the end word of “RAMP”:
Start --> LION --> LIMN --> LIMP --> LAMP --> RAMP --> End
Word ladders are fun because they offer a perfect blend of challenge and creativity. They engage you by requiring you to change one letter at a time to form new words, making the process feel like a puzzle with multiple solutions. The best part of this is that word ladders can also be analysed through graph theory.
Each word can be considered a node, and an edge exists between two nodes if one word can be transformed into the other by changing just one letter and by computing the Hamming distance between words. This turns the game into a graph traversal problem, where the goal is to find the shortest path from the start word to the end word.
With the right tools and programming language, this is pretty easy to implement, and so that’s exactly what I did. But before we get to the code, there are a few terms worth familiarising ourselves with.
What is graph theory? Graph theory is a branch of mathematics that studies graphs, which are structures made up of nodes (vertices) and edges (connections between nodes). It focuses on the relationships between these nodes and explores problems like finding the shortest path between two nodes, determining connectivity, or optimising routes.
What is a Hamming distance? Hamming distance is a measure of how different two strings (usually binary or text) are by counting the number of positions at which the corresponding characters or bits are different. For example, the Hamming distance between “LAMP” and “RAMP” is 1, because they differ in only one position.
I used networkx - an awesome Python library for building and studying complex networks and graphs (check out “NetworkX for Beginners”) - along with requests to gather my word list from a remote source.
import networkx as nx
import requests

from itertools import combinations

r = requests.get("https://raw.githubusercontent.com/melissa-perez/cs2a-mastermind-final-project/refs/heads/master/4-letter-words.txt")

words = r.text.split("\n")
With our word list defined, we need to define our Hamming distance function:
def hamming(w1, w2):
    l1, l2 = len(w1), len(w2)
    if l1 != l2:
        return -1
    return l1 - sum([c1 == c2 for c1, c2 in zip(w1, w2)])
Using the Hamming function, we can now get to the fun part. In order to generate a graph, we need to iterate over all pairs of words, computing the Hamming distance for each and only adding edges to the graph if they have a distance of one.
G = nx.Graph()

for w1, w2 in combinations(words, 2):
    if hamming(w1, w2) == 1:
        print(w1, w2)
        G.add_edge(w1, w2)
And now, to test this out, we can solve the word ladder by calculating the shortest path between two words.
w1 = "LION"
w2 = "RAMP"

path = nx.shortest_path(G, source=w1, target=w2)
print(path) # ['LION', 'LIMN', 'LIMP', 'LAMP', 'RAMP']
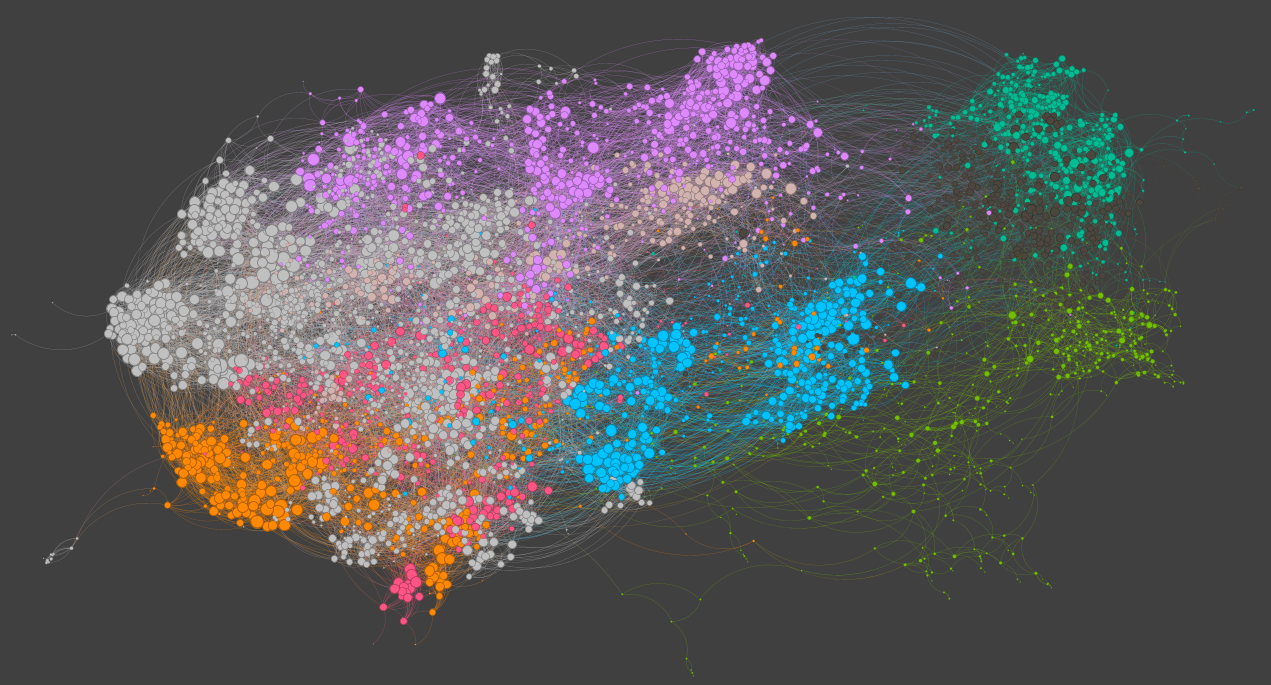
For all four-letter words, this produces a graph with 4,939 words (nodes) and 28,297 pairs (edges). For fun, I thought I would see what this would look like if I loaded it into Gephi. Interestingly, there are quite a few clusters of words, as shown by the rather colourful visualisation. Fun fact: the most connected word (by degree) is “MARE” with 36 connections!
Graph theory isn’t just great for solving word ladders – it’s a useful tool for solving all sorts of problems. The same ideas can be used to map social networks, optimise travel routes, or even study how diseases spread. By looking at different challenges through the lens of graphs, we can find smart ways to connect the dots, whether it’s in language puzzles, logistics, or data science. It’s all about shifting our perspective and letting the right tools do the hard work!